When it comes to data logging and viewing readings from the virtual robots sensors, there are three levels of reporting:
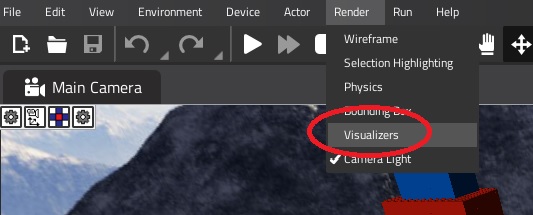
1) Visualizers: a graphical representation of what the virtual robots sensors are seeing. To enable visualizers, click on the 'Render' menu and click 'visualizers'.
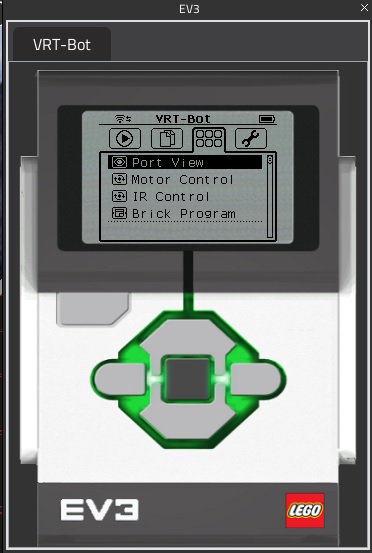
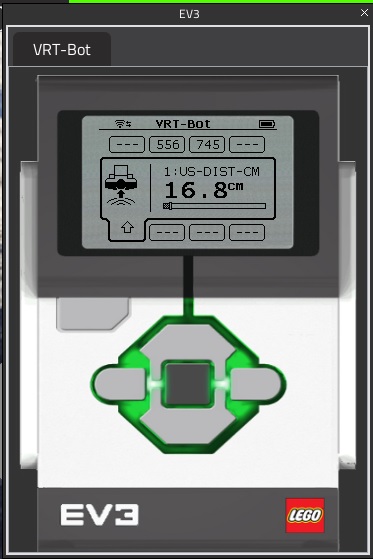
2) Port View: You can use the LEGO Mindstorms 'Port view' option on the virtual brick.
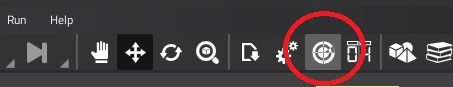
3) Real-time Data: For a more detailed account of what the sensors are seeing, click on the 'Real-time' data button on the Toolkit's toolbar. For more information about real-time data, check out our website!
More information about data logging: https://www.virtualroboticstoolkit.com/documentation/sections/7/articles/117
Comments
0 comments
Please sign in to leave a comment.